Weekly chart for 4/1-4/4
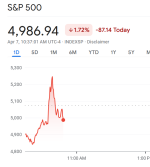
No one needs a bunch of technical bologne to tell them this was a bad week for the markets, but perhaps to illustrate what kind of rarified air we are in:
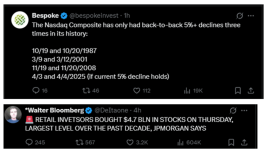
For reference - this is equal to '87 crash, the dotcom bubble burst, the 2008 financial crisis - we have in many ways surpassed what covid did to the market. I am saddened to see that retail is still throwing cash into this dumpsterfire - if any of you are reading this and thinking of "buying the dip" dont touch your wallet this is not the bottom.
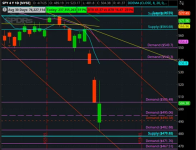
I am a big believer in technical analysis being able to indicate market direction - we have dropped so much there's not a ton of recent price levels you can use for analysis, but comparing price movement to the 2020 covid crash:
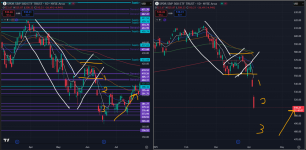
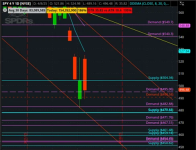
In the 2020 crash (graph on the left) we had 3 consecutive gap down days before finding a rough bottom that the market eventually recovered from. If we apply that to the current chart (graph on the right) we are due another gap down on Monday. Markets do learn from past movement, I dont expect the gap down to be as severe as what we saw in '20 but I am confident we go lower Monday.
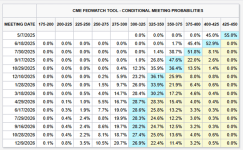
Next week we have several earnings reports for several large banks and airlines - banks in particular are likely ot have bad earnings given what has already happened in the market since January and even worse will be their revised guidance for q2 - these are going to provide downward pricing pressure outside of the macro economic conditions that have sabotaged the economic status quo. Powell spoke today in the FOMC briefing and basically said the fed is not going to come down off the machine and save the day with rate cuts. I really dont see anything that the market can use as a turning point in the near future.
Here is the weekly chart i will be trading off of for SPY, i am not super confident in the support levels as we are in such rare conditions that they have had to go back several months to find relevant supports:
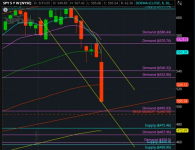
A technical definition of a Bear market is a 20% reduction from ATH = that would be $490 for SPY/4905 for SPX. With very near mathematical certainty we will test those levels in the next 2-3 weeks of trading, with almost 80% chance of reaching that level in the next week. IV has skyrocketed as VIX has finally started to catch up to what we are seeing in the indexes, be careful with long term options for those interested, but right now I think shorting every pump we see is going to be a winning strategy for the short term future.
Edit: still a little drunk when I wrote this Covid happened in 2020 not 2022 - too many 2s and too much 1738.


